Examples
-
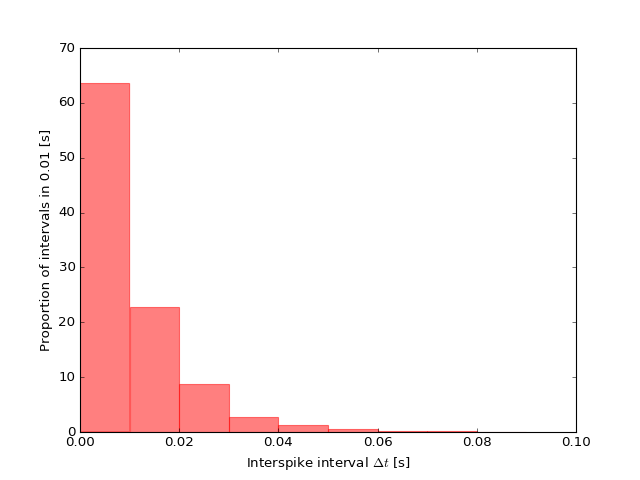
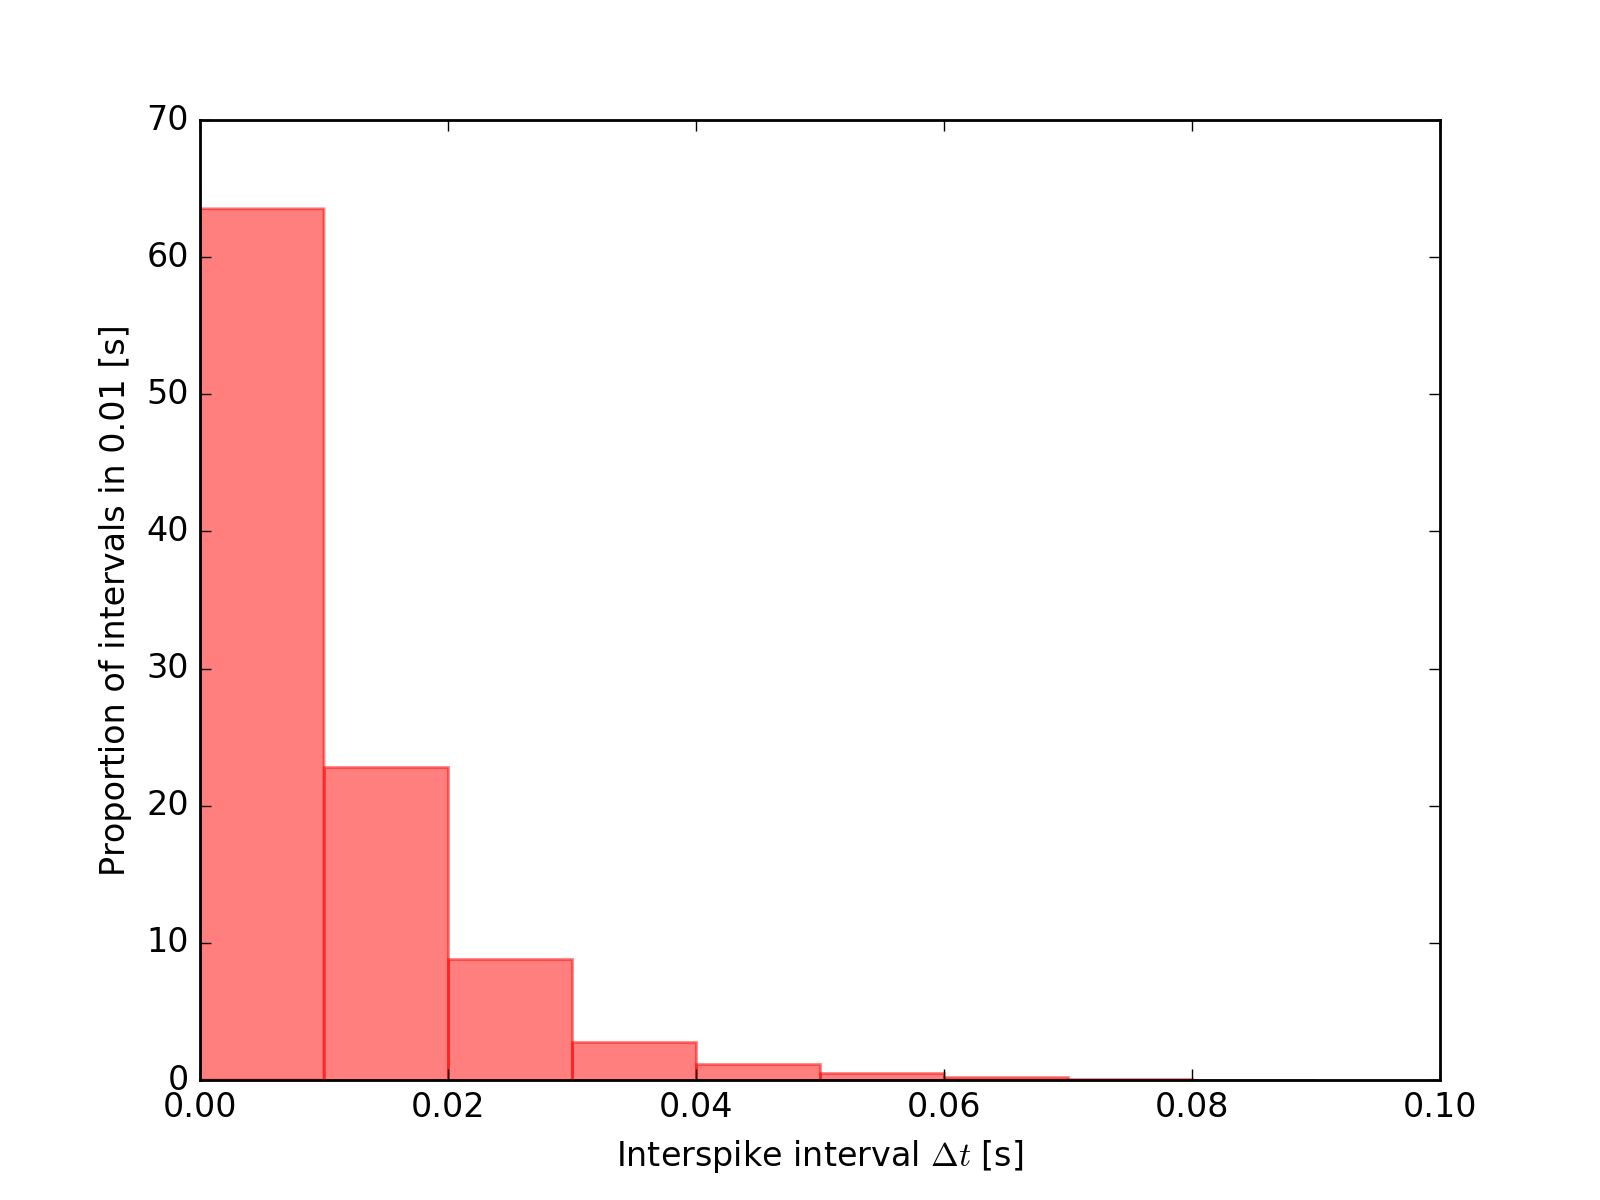
statistics_plot.plot_isi_hist(sptr, alpha=1, ax=None, binsize=array(2.0) * ms, time_limit=array(100.0) * ms, color='b', edgecolor=None)[source]¶ Bar plot of interspike interval (ISI) histogram
Parameters: - sptr (neo.SpikeTrain)
- color (str) – color of histogram
- edgecolor (str) – edgecolor of histogram
- ax (matplotlib axes)
- alpha (float) – opacity
- binsize (Quantity(s)) – binsize of spike rate histogram, default 2 ms
- time_limit (Quantity(s)) – end time of histogram x limit, default 100 ms
Examples
>>> import neo
>>> from numpy.random import rand
>>> spike_train = neo.SpikeTrain(rand(1000) * 10, t_stop=10, units='s')
>>> ax = plot_isi_hist(spike_train, alpha=.1, binsize=10*pq.ms,
...                    time_limit=100*pq.ms, color='r', edgecolor='r')
(Source code, png, hires.png, pdf)

Returns: out Return type: axes
-
statistics_plot.plot_spike_histogram(trials, color='b', ax=None, binsize=None, bins=None, output='counts', edgecolor=None, alpha=1.0, ylabel=None, nbins=None)[source]¶ histogram plot of trials
Parameters: - trials (list of neo.SpikeTrains)
- color (str) – Color of histogram.
- edgecolor (str) – Color of histogram edges.
- ax (matplotlib axes)
- output (str) – Accepts ‘counts’, ‘rate’ or ‘mean’.
- binsize – Binsize of spike rate histogram, default None, if not None then bins are overridden.
- nbins (int) – Number of bins, defaults to 100 if binsize is None.
- ylabel (str) – The ylabel of the plot, if None defaults to output type.
Examples
>>> import neo
>>> from numpy.random import rand
>>> from exana.stimulus import make_spiketrain_trials
>>> spike_train = neo.SpikeTrain(rand(1000) * 10, t_stop=10, units='s')
>>> epoch = neo.Epoch(times=np.arange(0, 10, 1) * pq.s,
...                   durations=[.5] * 10 * pq.s)
>>> trials = make_spiketrain_trials(spike_train, epoch)
>>> ax = plot_spike_histogram(trials, color='r', edgecolor='b',
...                           binsize=1 * pq.ms, output='rate', alpha=.5)
Returns: out Return type: axes
-
statistics_plot.plot_xcorr(spike_trains, colors=None, edgecolors=None, fig=None, density=True, alpha=1.0, gs=None, binsize=array(1.0) * ms, time_limit=array(1.0) * s, split_colors=True, xcolor='k', xedgecolor='k', xticksvisible=True, yticksvisible=True, acorr=True, ylim=None, names=None)[source]¶ Bar plot of crosscorrelation of multiple spiketrians
Parameters: - spike_trains (list of neo.SpikeTrain or neo.SpikeTrain)
- colors (list or str) – colors of histogram
- edgecolors (list or str) – edgecolor of histogram
- ax (matplotlib axes)
- alpha (float) – opacity
- binsize (Quantity) – binsize of spike rate histogram, default 2 ms
- time_limit (Quantity) – end time of histogram x limit, default 100 ms
- gs (instance of matplotlib.gridspec)
- split_colors (bool) – if True splits crosscorrelations into colors from respective autocorrelations
- xcolor (str) – color of crosscorrelations
- xedgecolor (str) – edgecolor of crosscorrelations
- xticksvisible (bool) – show xtics on crosscorrelations, (True by default)
- yticksvisible (bool) – show ytics on crosscorrelations, (True by default)
- acorr (bool) – show autocorrelations, (True by default)
Examples
>>> import neo
>>> from numpy.random import rand
>>> sptr1 = neo.SpikeTrain(rand(100) * 2, t_stop=2, units='s')
>>> sptr2 = neo.SpikeTrain(rand(100) * 2, t_stop=2, units='s')
>>> sptr3 = neo.SpikeTrain(rand(100) * 2, t_stop=2, units='s')
>>> fig = plot_xcorr([sptr1, sptr2, sptr3])
Returns: out Return type: fig